
Top 5 SQL Monitor Features
SQL Monitor is one cool tool. Via EM12c, it empowers everyone, (yes, that means the developer, too, so give them the access to view this data via Cloud Control, please!) This is a top five list, but it doesn’t stop there, just remember, this is my favorite features when using Cloud Control with SQL Monitoring.
Once logged into the database, you can gain access to SQL Monitor by clicking on Performance –> SQL Monitoring.
1. High Level View
The main view of active and inactive processing, (just remember, SQL Monitor processes will age out, so keep that in mind that this tool isn’t for looking at historical processing.) is a great place to start when we talk about value to your day to day job.
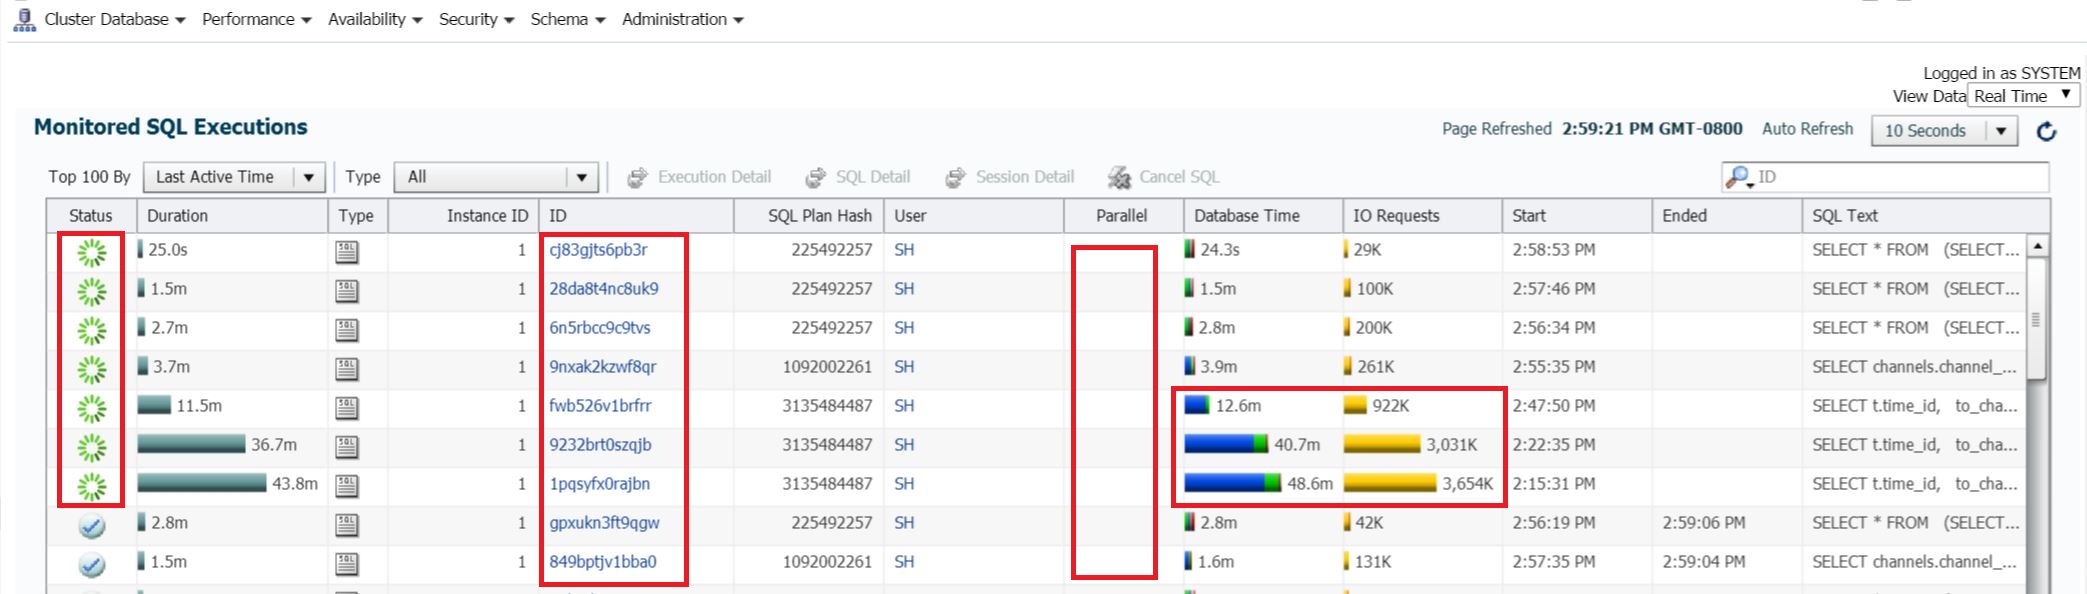
From the main view, you can easily see what sessions are active, the SQLID, if there is parallel and what the DOP, (Degree of Parallelism) granted, database time, (broken down by wait event percentage) and IO Requests. There is a ton of pertinent data here, including plan hash values, start and stop time, plus the SQL Text, but everyone has to admit, this is what we all want and need to know.
2. SQL ID Details via SQL Monitor
By clicking on any of the SQLIDs displayed in the SQL Monitor main page, you can then dig into the details surrounding a SQL process.
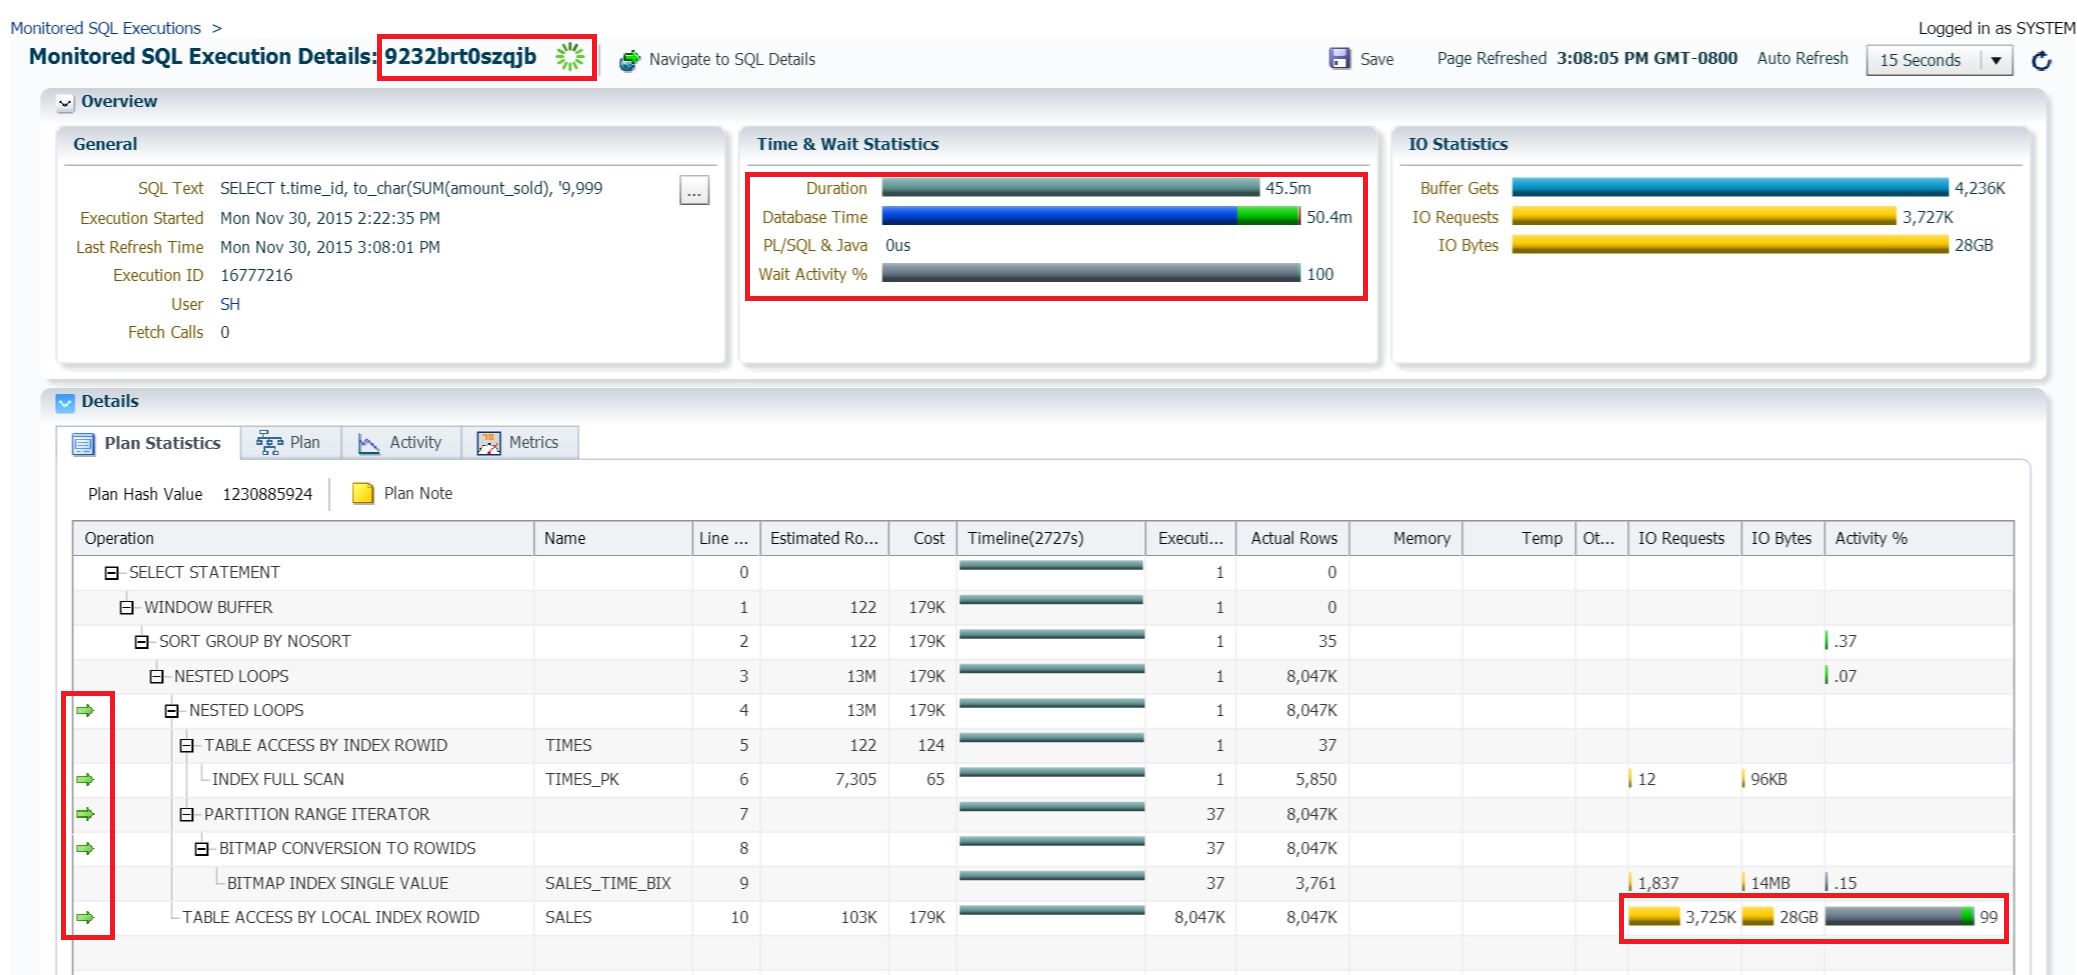
For the given SQLID, you can view the duration and type of wait event resource consumption. You can quickly see what the cost is and in graphs added, quickly identify what performance challenges a particular execution plan is most hindered by. There are arrows to help the DBA or developer navigate the plan to understand what pain points are most evident and where the plan connects from bottom to top as the process filters through data to come up with it’s results.
3. Offload Percent
Yes, you can use a query to see the offload percent for a process, but SQL Monitor is nice enough to show you right in Cloud Control-
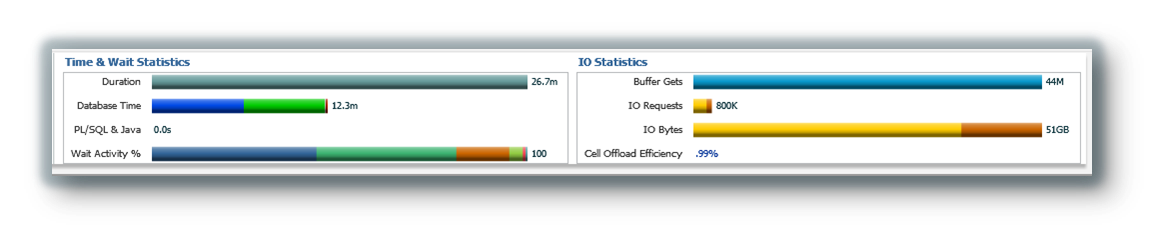
If you’re working on an Exadata and want to make sure you’re using all those great engineered system features you paid for, it’s nice to know you’re offloading to a cell node vs. doing the work on your database node that should be used for other work than scanning objects.
4. Resource Usage Details for a Distinct SQLID
Knowing how many resources are going to a process are essential to knowing how to eliminate extra resource usage.

Under Metrics for each SQLID captured by SQL Monitor, you’ll be able to view the amount of CPU, PGA and IO used by the process. You’ll even be able to tell what kind of waits you’re experiencing if you don’t use Google Chrome, (I’m joking…OK, maybe I’m not, but you understand browser challenges, I’m sure… :))
5. Session Details
By clicking on the User from the main view, I’m able to log into the session details. The actual session ID won’t be displayed, (in this case, we just see SH for each session) but we can click on the link, there by displaying vital info about the session details.
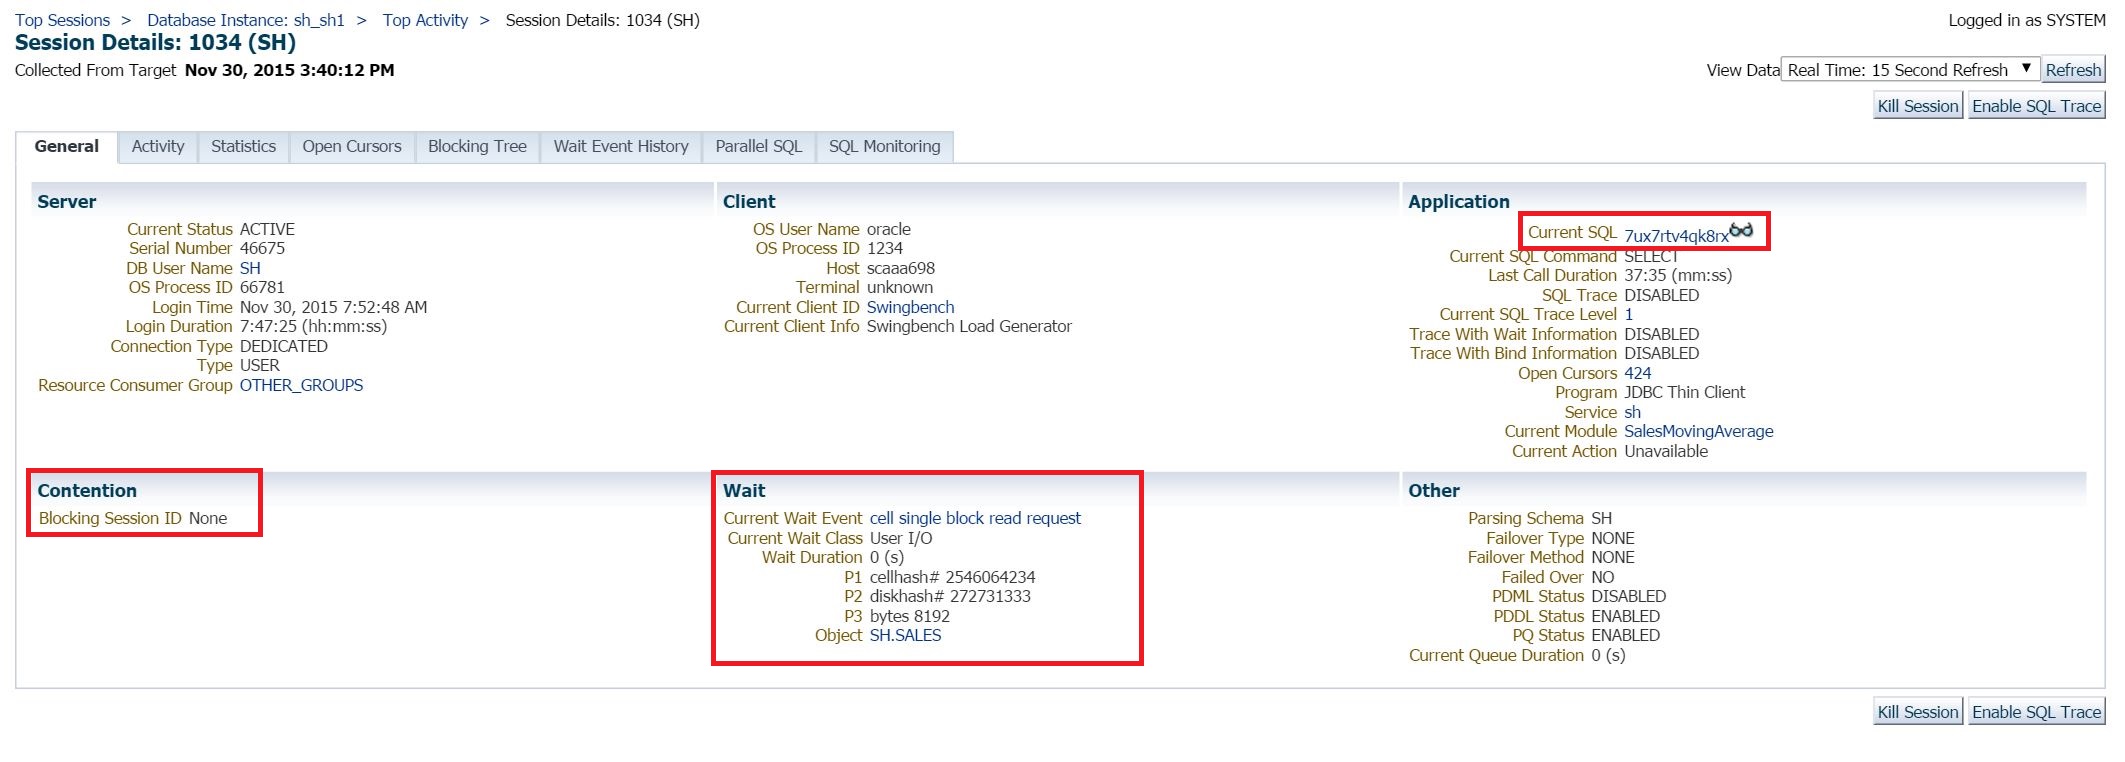
We can quickly link to the SQLID, view if there are any session blocking the one we are investigating and see pertinent wait information including the P1, P2 and P3 waits.
If I click on the bottom link in the WAIT section, it will take me to the object that is causing the most waits, which happens to be the SALES table.
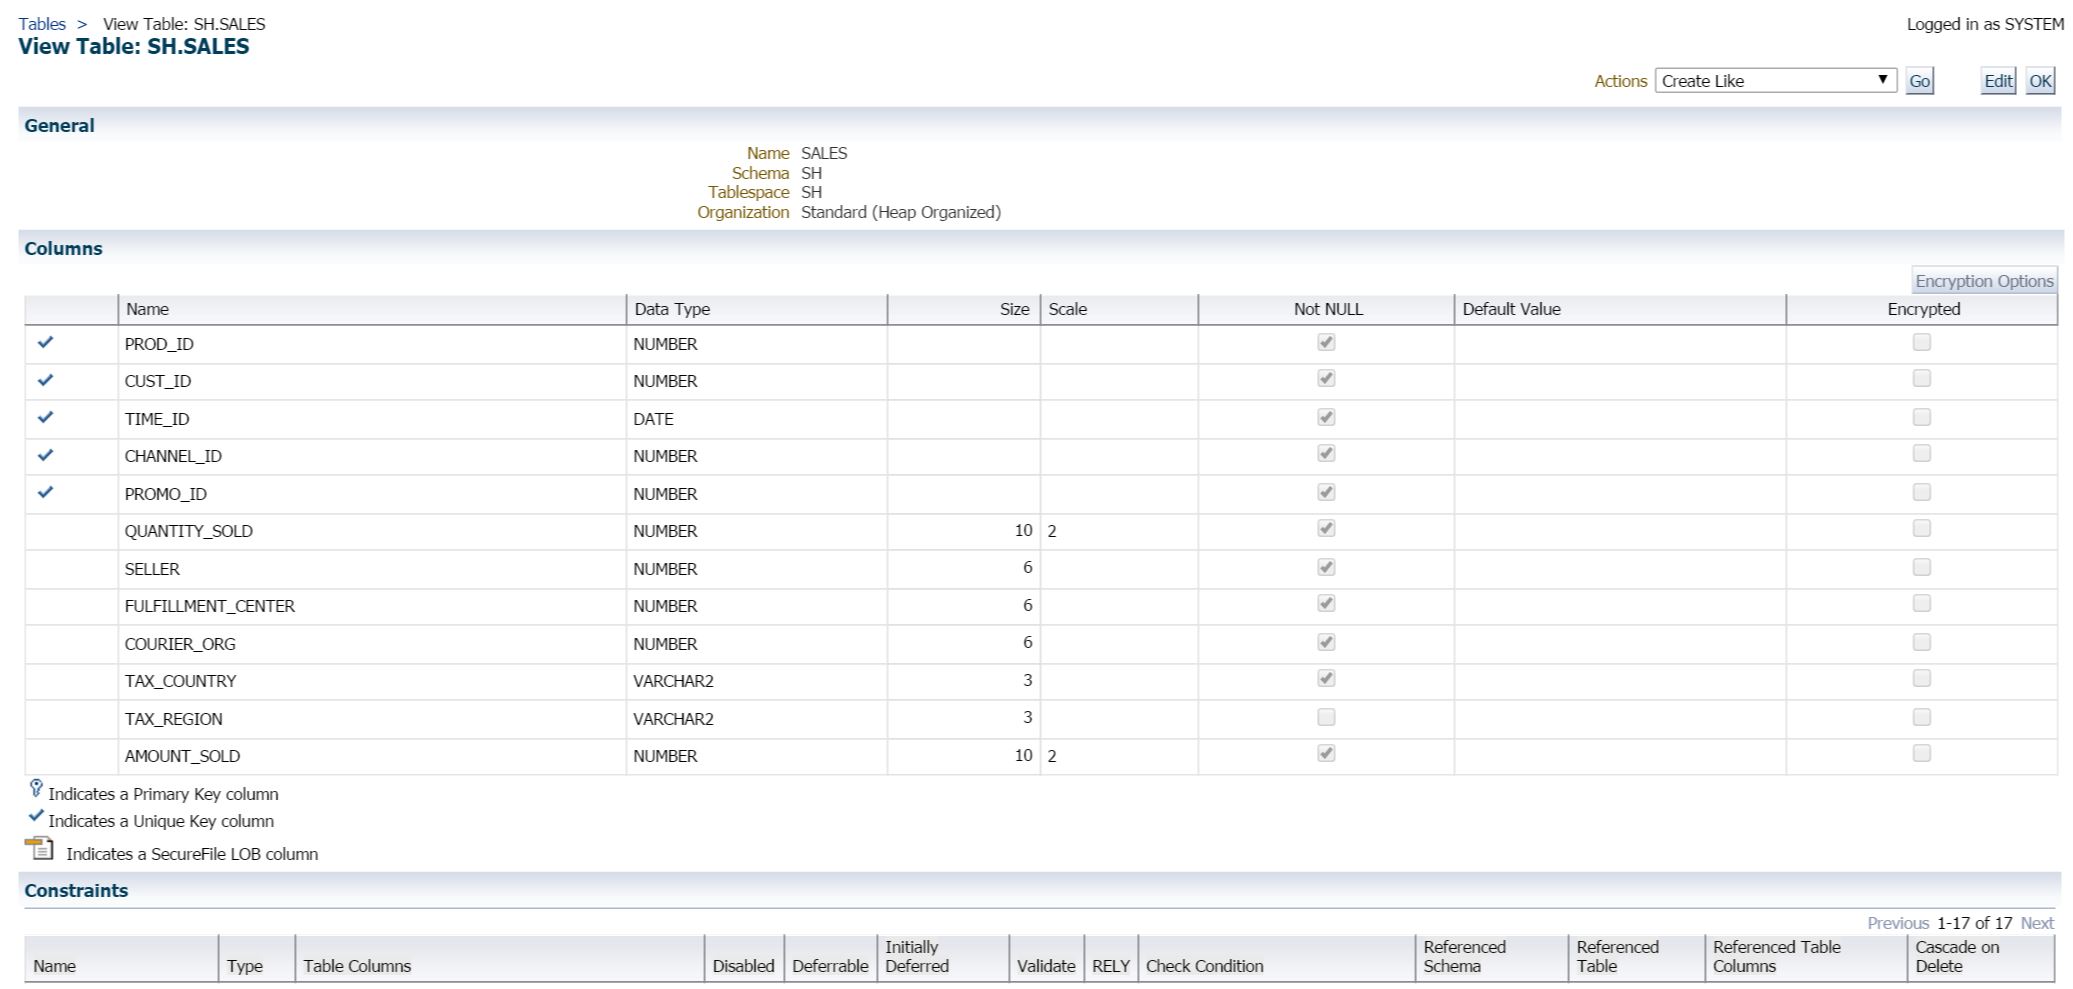
I can now view column and constraint info without having to go to the schema feature within Cloud Control.
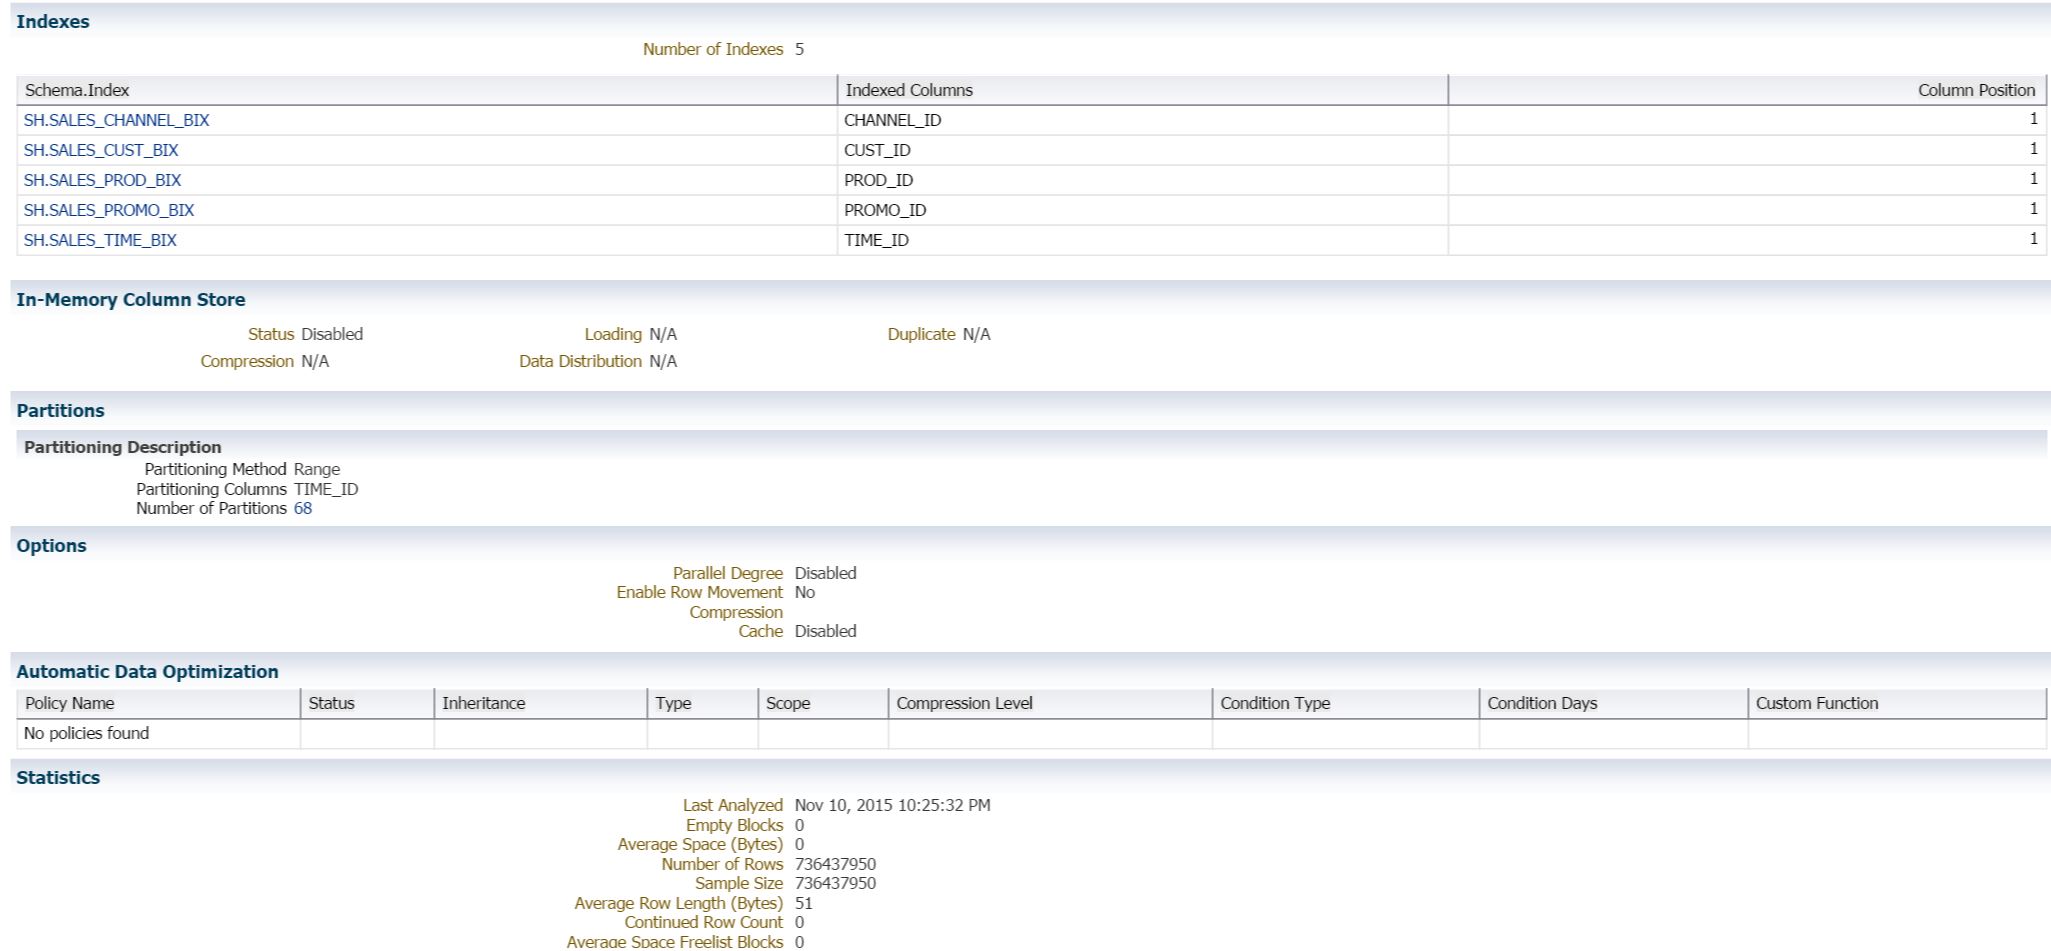
I can also view information about indexes and statistics, which no longer is accessible from SQL Details in Cloud Control.
6. (Bonus) Viewing Waits and Pain Points
As a bonus, knowing how many of us like to see tabular vs. graphical execution plans, it may be worthwhile to also view them in graphical form. Below you can see as I hover my cursor over the sections that are highlighted with yellow lines from the Sales table and then Red for the filtering, you can note that it clearly displays that there are 13 million rows having a nested loop performed out of a 26 million row table. I think most of us know that a hash join would have performed much faster and this is why the section has been highlighted in red as the pain point for the SQL in question.

Just a little bonus for those of you still as hooked on tabular execution plans as I am… 
Have a great week after the long weekend and hope your Thanksgiving was wonderful!